Section 3 Self-Storage Supply Forecast
W

hile in-progress self-storage construction levels remain high, the majority of these builds began in late 2023 or early 2024. Since then, new deliveries have dropped significantly, moving at a much slower pace given interest rates, the rental rate environment, and lack of market confidence. While the Federal Reserve’s rate cut in November 2024 should offer smaller monthly mortgage payments for homebuyers, experts feel it’s unlikely to lead to a surge in demand for storage. Even with the rate cut, many believe it will remain difficult for homebuyers to purchase a home at a reasonable price. While the heated 2024 election has been settled, providing some stability, the new administration’s policies, under President Trump’s leadership, also begs questions that only time can answer.

Today’s market is witnessing some of the weakest demand dynamics the sector has seen, in part because of low home sales caused by high interest rates. Google Trends even shows that national search interest for self-storage is at an eight-year low.
Near-Term Forecast 2024 To 2025
Today’s market is witnessing some of the weakest demand dynamics the sector has seen, in part because of low home sales caused by high interest rates. Google Trends even shows that national search interest for self-storage is at an eight-year low (See Chart 3.1 below). Despite this, many facilities remain under construction, with the current level of builds even exceeding what the industry witnessed in 2018, a year that was once considered the peak of oversupply. However, once these builds are completed, assuming they are not abandoned, new starts are at a low and it is expected that this level off will continue in the coming years.

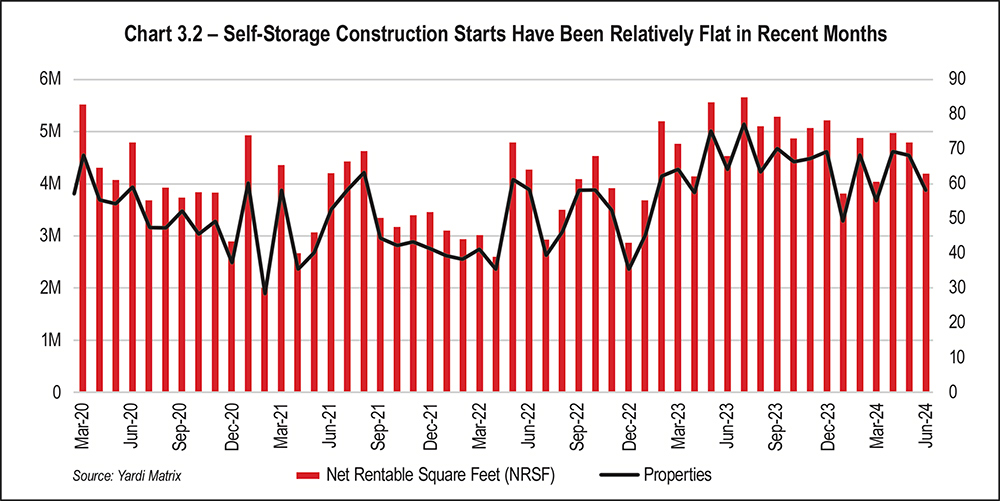
On average, the under-construction pipeline was relatively flat in 2024, averaging around 59 million net rentable square feet (NRSF) (See Chart 3.2 on page 32). Plus, the monthly average rate at which planned projects moved to under construction continued to trend downward. (It should be noted that the new data includes 17 new self-storage markets, so while the level of the forecast has increased, the rate of change remains the same.)

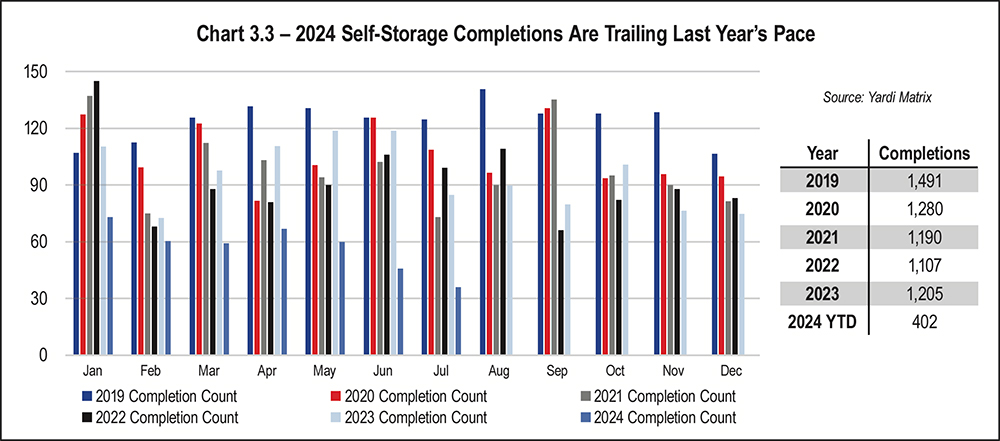
Self-storage completions are also behind that of previous years. In November 2024, approximately one-third of projects had been completed compared to 2023 (See Chart 3.3 on page 32).

Chart 3.1 - Google Trends Shows National Search Interest for Self-Storage at an 8-Year Low
The cycling percentages for self-storage projects that move from planned to abandoned status continue to remain high; and while they are lower than the 2023 average, they remain well above pre-pandemic levels (See Chart 3.4 on the opposite page). However, this should also be viewed in the context of the broader data. The combination of oversupply and a challenging leasing environment suggests that the sector will remain burdened with builds for the next few years; a major pause in construction like the sector experienced between 2008 and 2014 has not materialized just yet, but all data points in that direction.

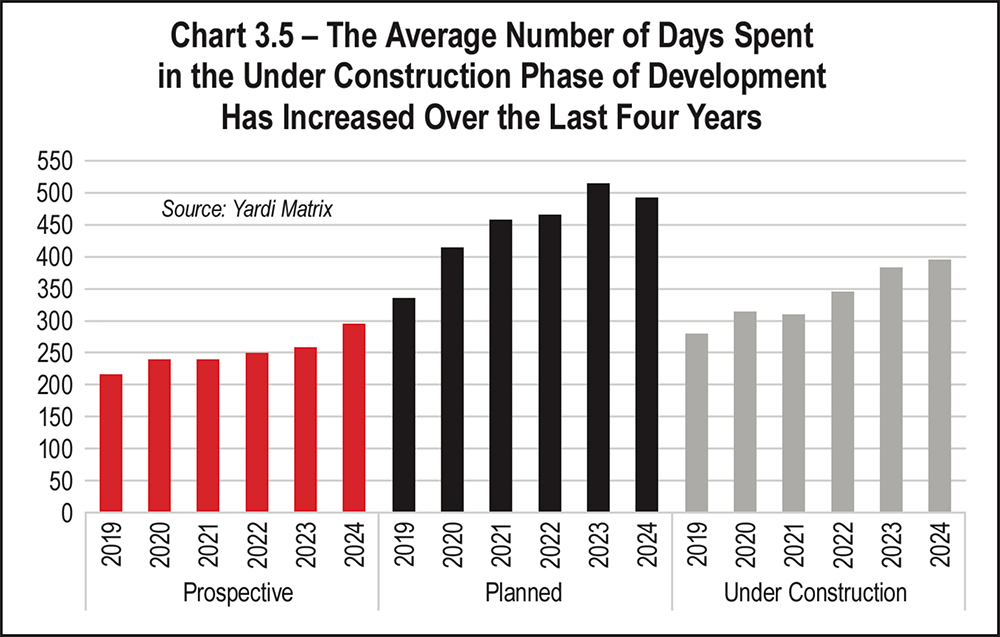
Planning and construction timelines continue to oppose one another. While the number of days spent in planning has decreased slightly, the number of days in construction has increased, from under a year (~275 days in 2019) to over a year (~400 days in 2024). (See Chart 3.5 on page 33).

Chart 3.2 - Self-Storage Construction Starts Have Been Relatively Flat in Recent Months
Chart 3.3 - 2024 Self-Storage Completions Are Trailing Last Year's Pace
Long-Term Forecast: 2026 Through 2029
The supply trend for self-storage will continue to level off in 2025, and even more so in the coming years. As seen in Table 3.1 on page 34, property forecasts slash the expected supply almost in half between now and 2029 (from 907 projects in 2024 to 455 in 2029, a decrease of 49.8 percent). This is based on these data points:

  • The planned pipeline contracted quarter-over-quarter for the first time,
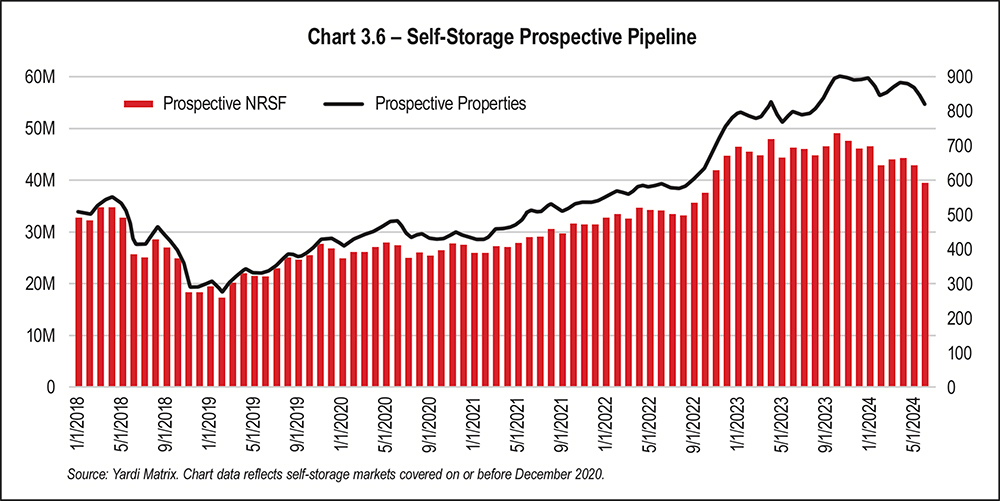
  • The prospective pipeline continued to contract, and
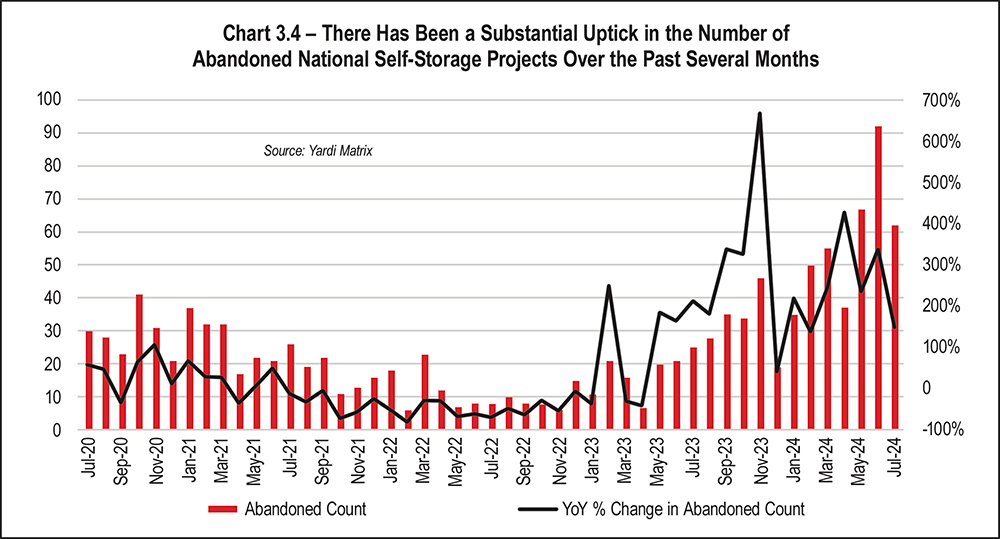
  • The number of abandoned self-storage projects continues to increase.
Chart 3.4 - There Has Been a Substantial Uptick in the Number of Abandoned National Self-Storage Projects Over the Past Several Months
Chart 3.5 - The Average Number of Days Spent in the Under Construction Phase of Development Has Increased Over the Last Four Years
The self-storage prospective pipeline continues to shrink (See Chart 3.6 on page 34). For markets tracked on or before December 2020, the prospective pipeline currently contains 39.4 million NRSF, or 93.7 percent of the total prospective pipeline of 42.0 million NRSF. The prospective pipeline peaked in late 2023 and has since steadily declined. Quarter-over-quarter figures saw a 9.65 percent decrease, while year over year the prospective pipeline has decreased by 14.4 percent.

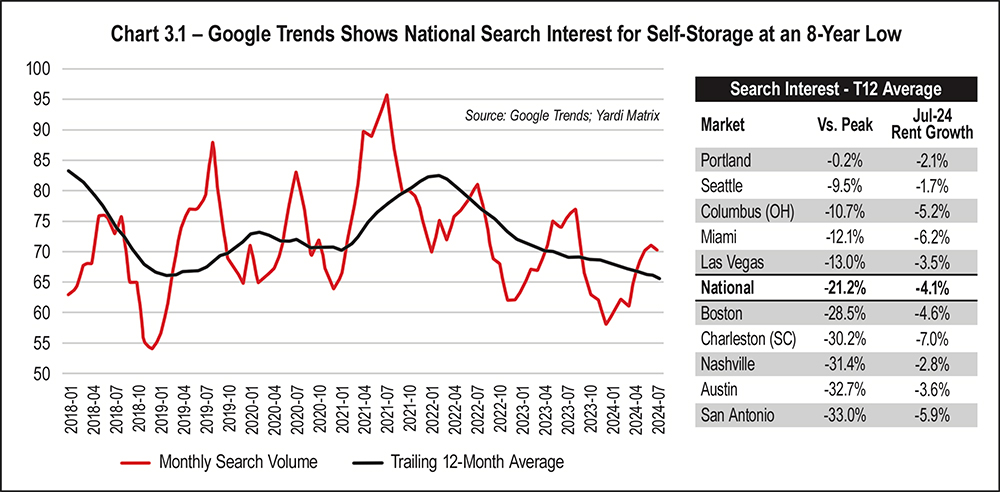
Yardi does report that markets that just a few years ago had the weakest growth patterns and issues with new supply have emerged as top performers. Although advertised rent growth is still negative, the report puts Denver, New York, Portland, Seattle, and Washington, D.C., into this camp. This demonstrates that markets can outperform coming out of a high-supply cycle and shows the advantages of having a geographically diversified portfolio that balances high growth/high supply with slow growth/moderate supply markets and submarkets.

Table 3.1 - Forecast of New Self-Storage Supply Summary
Bottom Line
Following the completion of the many self-storage builds in progress, development pipeline data indicates a major slowdown in construction and a sharp increase in abandoned projects. The lowered enthusiasm in development may be due to a “perfect storm” of reasons, including negative street-rate rental growth, lower occupancy levels and the REITs response to it, and tight financial and economic conditions. Of course, it can be difficult to predict what is to come following an election year, however many feel the president-elect will fulfill his promise of less regulation, providing some relief in capital requirements and possibly more favorable reporting and booking of assets and liabilities. The new administration is also expected to offer capital gains treatment on sales, potentially providing better transaction incentives for buyers and sellers. The possible implementation of tariffs, however, could result in inflation, increasing the cost of capital, impacting how much owners are able to borrow, and creating spending pressures on consumers.

Ultimately, the biggest impact on self-storage right now is being able to solve for more movement in home sales. Currently 70 percent of all existing homeowners have mortgages under 4 percent, housing prices are on the rise, and interest rates on purchases are elevated. This means mobility will likely remain flat. Promises have been made for more affordable housing, and there may be a marked improvement if this comes to fruition.

Lastly, it’s important to remember that supply is relative to the specific submarket in which facilities operate. While national trends are alarming, each submarket tells its own story, and there are cases to be made for individual sites that may fare better than others. With supply being the Achilles’ heel of the sector, it’s more important than ever to exercise a great deal of caution when developing. But some things are certain: Cycles come and go, and markets do recover.

Special thanks to Armand Aghadjanians (Store Here Self Storage), Neal Gussis (SPMI Capital), and Doug Ressler (Yardi) for their help in this reporting!

Chart 3.6 - Self-Storage Prospective Pipeline